Dashboard
Table of contents
- Open Requests
- SLA Violations
- Open and Unassigned Requests
- Open and SLA Violated Requests
- Daily Received Requests
- Daily Closed Requests
Dashboard helps to visualise the following parameters and dimensions using Pie-Chars and Graphs
Open Requests
Open requests can be visualised by priority, level and category which helps to understand the resource utilisation.
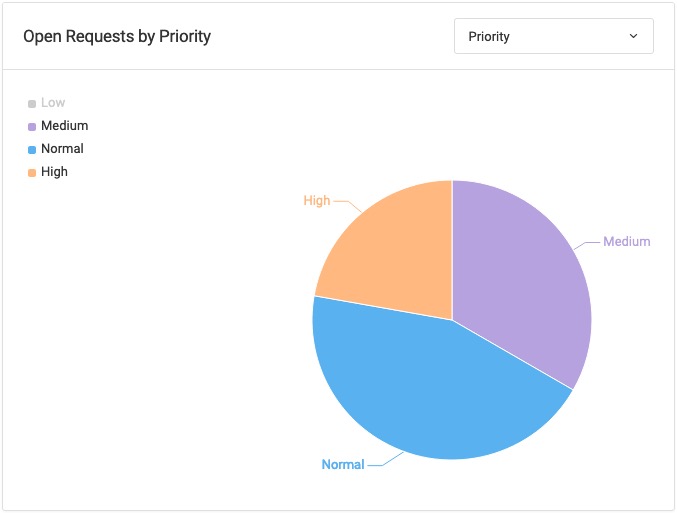
Open Requests by Priority
To Visualize the requests by priority, simply use the drop down button and select the Priority. Excessive number of higher priority indicates that resources are unable to meet the SLAs.
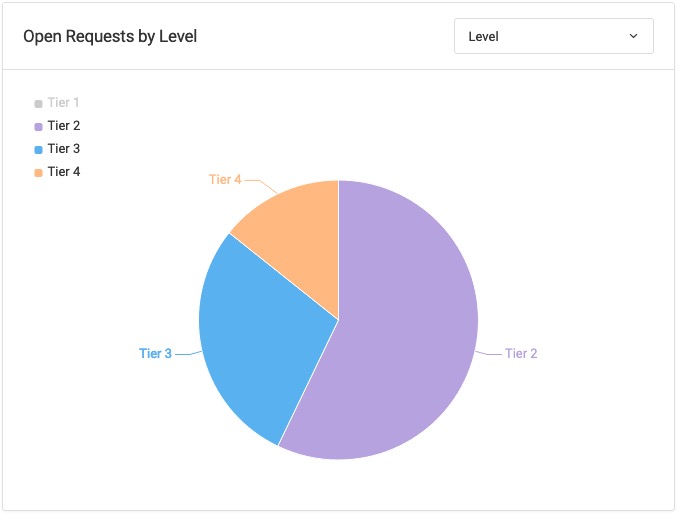
Open Requests by Level
To Visualize the requests by Level, simply use the drop down button and select the Level. A greater number of Tier indicates that the issues are pending in resolution and higher management is being called of.
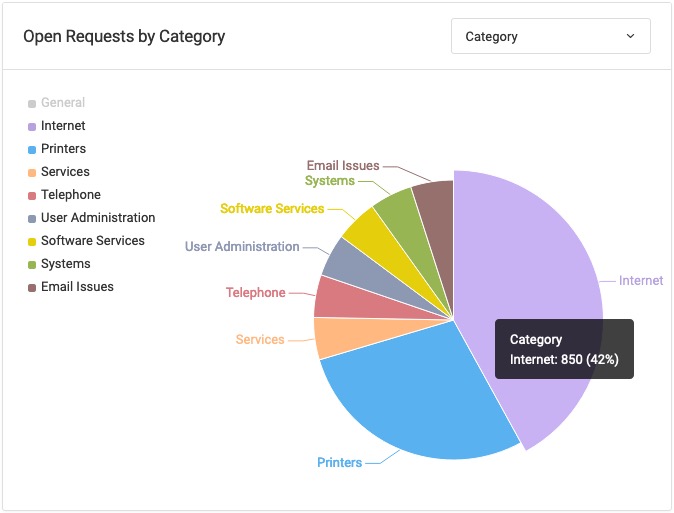
Open Requests by Category
To Visualize the requests by Category, simply use the drop down and select the Category. A graph will indicate which area needs more resources.
SLA Violations
SLA Violations can be visualized by Technicians, Priority, Level & Category.
SLA Violations by Technicians
To Visualize the SLA violations by technicians, simply use the drop down and select the Technicians. A graph will indicate which technicians have most SLA violations.
SLA Violations by Priority
To Visualize the SLA violations by priority, simply use the drop down and select the Priority. A graph will indicate that SLAs are violated at which priority level.
SLA Violations by Level
To Visualize the SLA violations by Level, simply use the drop down and select the Level. A graph will indicate that SLAs are violated at which level.
SLA Violations by Category
To Visualize the SLA violations by category, simply use the drop down and select the Category. A graph will indicate that SLAs are violated at which Category.